Let experts help. Manage your investments with us.
CONTACT US
We want to help you simplify your life and prepare for the future
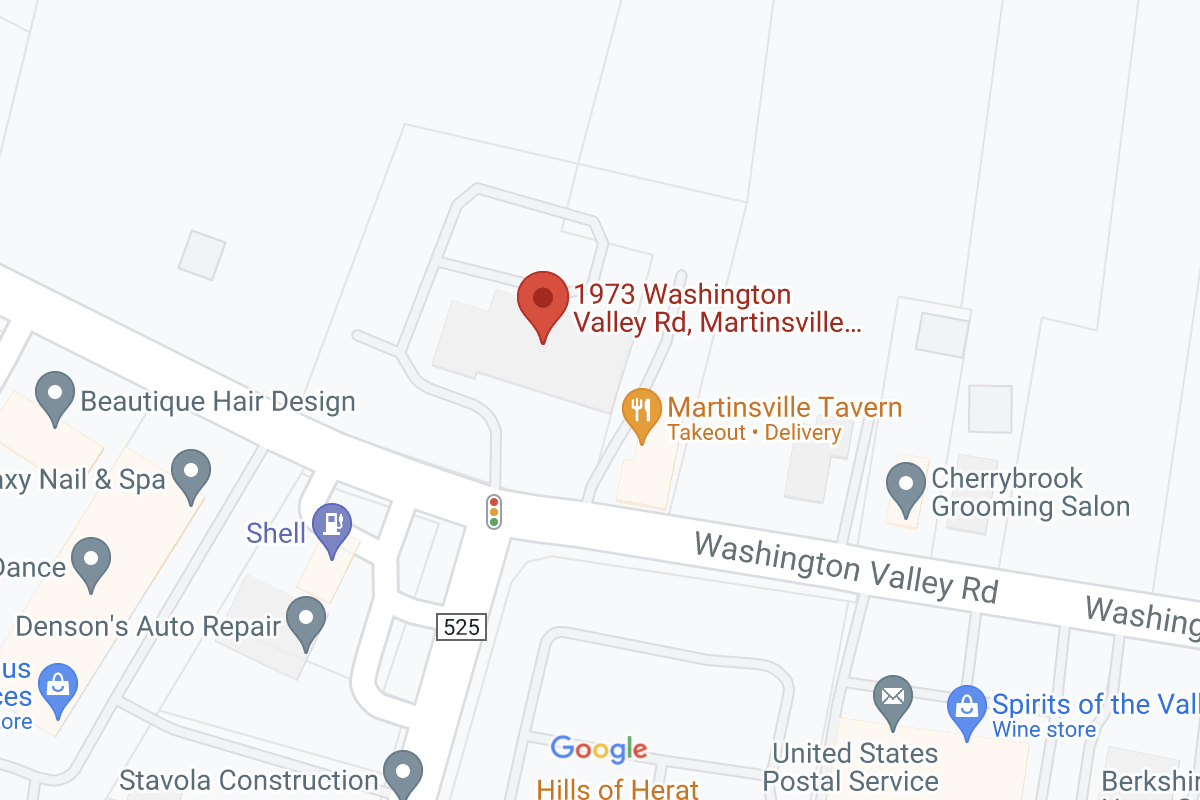
1973 Washington Valley Road
Martinsville, NJ 08836
(732) 356-7323
Let experts help. Manage your investments with us.
CONTACT US
1973 Washington Valley Road
Martinsville, NJ 08836
(732) 356-7323